
Module 3: Cash Flow
Cash flow diagram
Another way to think about cash flow is plumbing in a building. Like water, money flows in and out of a business. The valves represent the different decision points you have control over.
Take a look at this diagram to understand how money flows in and out of a business. We’ll take a closer look at these different components next.
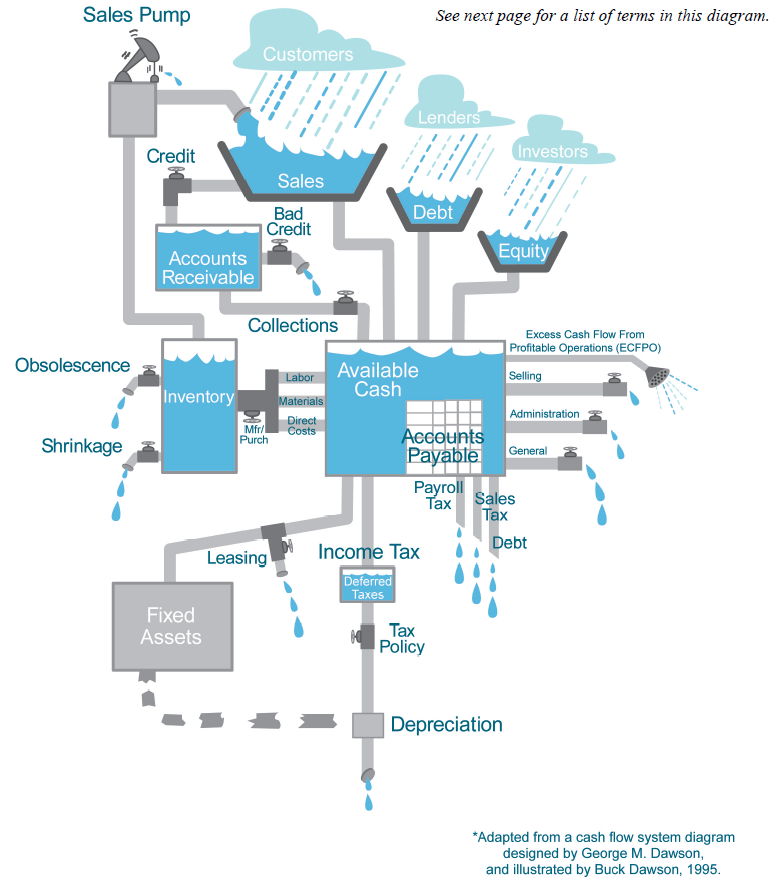
Diagram Definitions
As noted, the valves represent the different decision or control points you have over your business. The flow of cash can increase or decrease depending on your choices. Each will influence your probability of success which is to maximize profits while minimizing outflows of cash.
All valves are not created equal. Some valves are always open, such as taxes and debt which can’t be delayed or put off. These create a continual drain on your available cash, which is why they appear at the bottom of the diagram. Other valves are partially open, such as sales, general and administrative valves. As you spend available cash, the level in the center tank drops. You want to keep this level as high as possible.
Here are some things that can negatively impact that center tank:
Inventory. Products and services are a cost until they are sold. They tie up your money so it can’t be used elsewhere. Worse, inventory can become unsellable, either because it became obsolete (because a new model, color or design came out, for example) or because of shrink (it can’t be sold because it is no longer fresh or is past its pull date).
Fixed assets. These are usually expensive items like buildings, space upgrades, vehicles, machinery, equipment and computers. These assets tie up cash unless they are leased; leasing allows you to make monthly payments instead of a single large cash outlay.
Accounts receivable. Just because you make a sale doesn’t mean you can spend the money. Ultimately you want to convert your accounts receivable into cash that flows into the center tank. If you can’t collect on money owed, it leaks out as bad debt. The longer the debt goes unpaid, the less likely you can count on it to refill the tank.
There are other pipes that fill your center tank.
Sales pump. At the very top is your sales pump. This is your flow of customers, old and new. You need to acquire leads and close sales through your sales funnel. These drop into the pump in the form of cash that can flow elsewhere.
Accounts payable. Why is this located in the center of the tank, and why does it look like a pile of bricks? This is the money you owe vendors, suppliers and other creditors. Each brick raises the tank. Instead of having the cash drain out in the form of a payment, you can float the cash for a while and use it elsewhere. A good example is lines of credit from vendors that increase your cash flow. Just remember, the bills will come due at some point.
Balancing accounts payable and accounts receivable is a continual dance. Ideally, you want your customers to pay you as quickly as possible, and you want to pay your vendors as slowly as possible.
The showerhead on the right of the diagram represents the excess cash flow. This is your paycheck.
And what about the broken pipe between fixed assets and depreciation? These are things you can do to reduce your tax liability. This isn’t something we can cover here in detail. A tax adviser or accountant can give you better insights into using depreciation to create more available cash. We just wanted to point out that there was one more control point.